

What Do Arthritis, Diabetes, and So Many Other Chronic Diseases Have in Common?
(The Personal Fat Threshold Hypothesis and the Role of Chronic Low-Grade Generalized Inflammation as a Driver of Ill Health)

I. Obesity and Arthritis
Introduction: Old Age v. Inflammatory Arthritis
During my training, more than three decades ago, we were taught that arthritic conditions came in two general varieties: age-related and inflammatory. The former came on gradually and affected almost everyone once they reached a certain age. The latter came on suddenly, often earlier in life, and affected about one-fifth of people, women more than men.
Wear and Tear
Osteoarthritis (OA) or degenerative joint disease (DJD), colloquially known as old-age arthritis, was understood to result from excessive wear and tear on joints over time — a process that took place gradually and generally without significant amounts of swelling and inflammation. OA causes stiffness and discomfort but can be mostly painless for years until it progresses to the point where the soft-tissue structures of the joints have almost completely worn away — a situation often referred to clinically as ‘bone-on-bone.’
Soft tissue joint structures like cartilage (the coverings that protect the articular surfaces of bones), discs (the shock absorbers inside some joints that cushion impact), and synovia (the wrapping material that surrounds joints to lend structural support and eek a lubricant called synovial fluid into the joint to make movement smooth) become drier and more brittle as we age, making them susceptible to cracks and tears with normal use.
Vigorously stressing the soft tissues during hard labor, sports, or by carrying too much weight (in the case of weight-bearing joints like the knees), especially in our older years when those structures are drier and more brittle, wears them down at an accelerated rate, making joints less stable. In response to this, the bones that form the joints start to thicken through a process called bony hypertrophy in an attempt to restore stability, causing stiffness. Eventually, bony hypertrophy leads to the spike-like projections we see on X-rays known as osteophytes or bone spurs. So, OA/DJD is what happens to a body from excessive mechanical stress over time. Or so the story went (keep reading)…
Diagnosis of OA/DJD
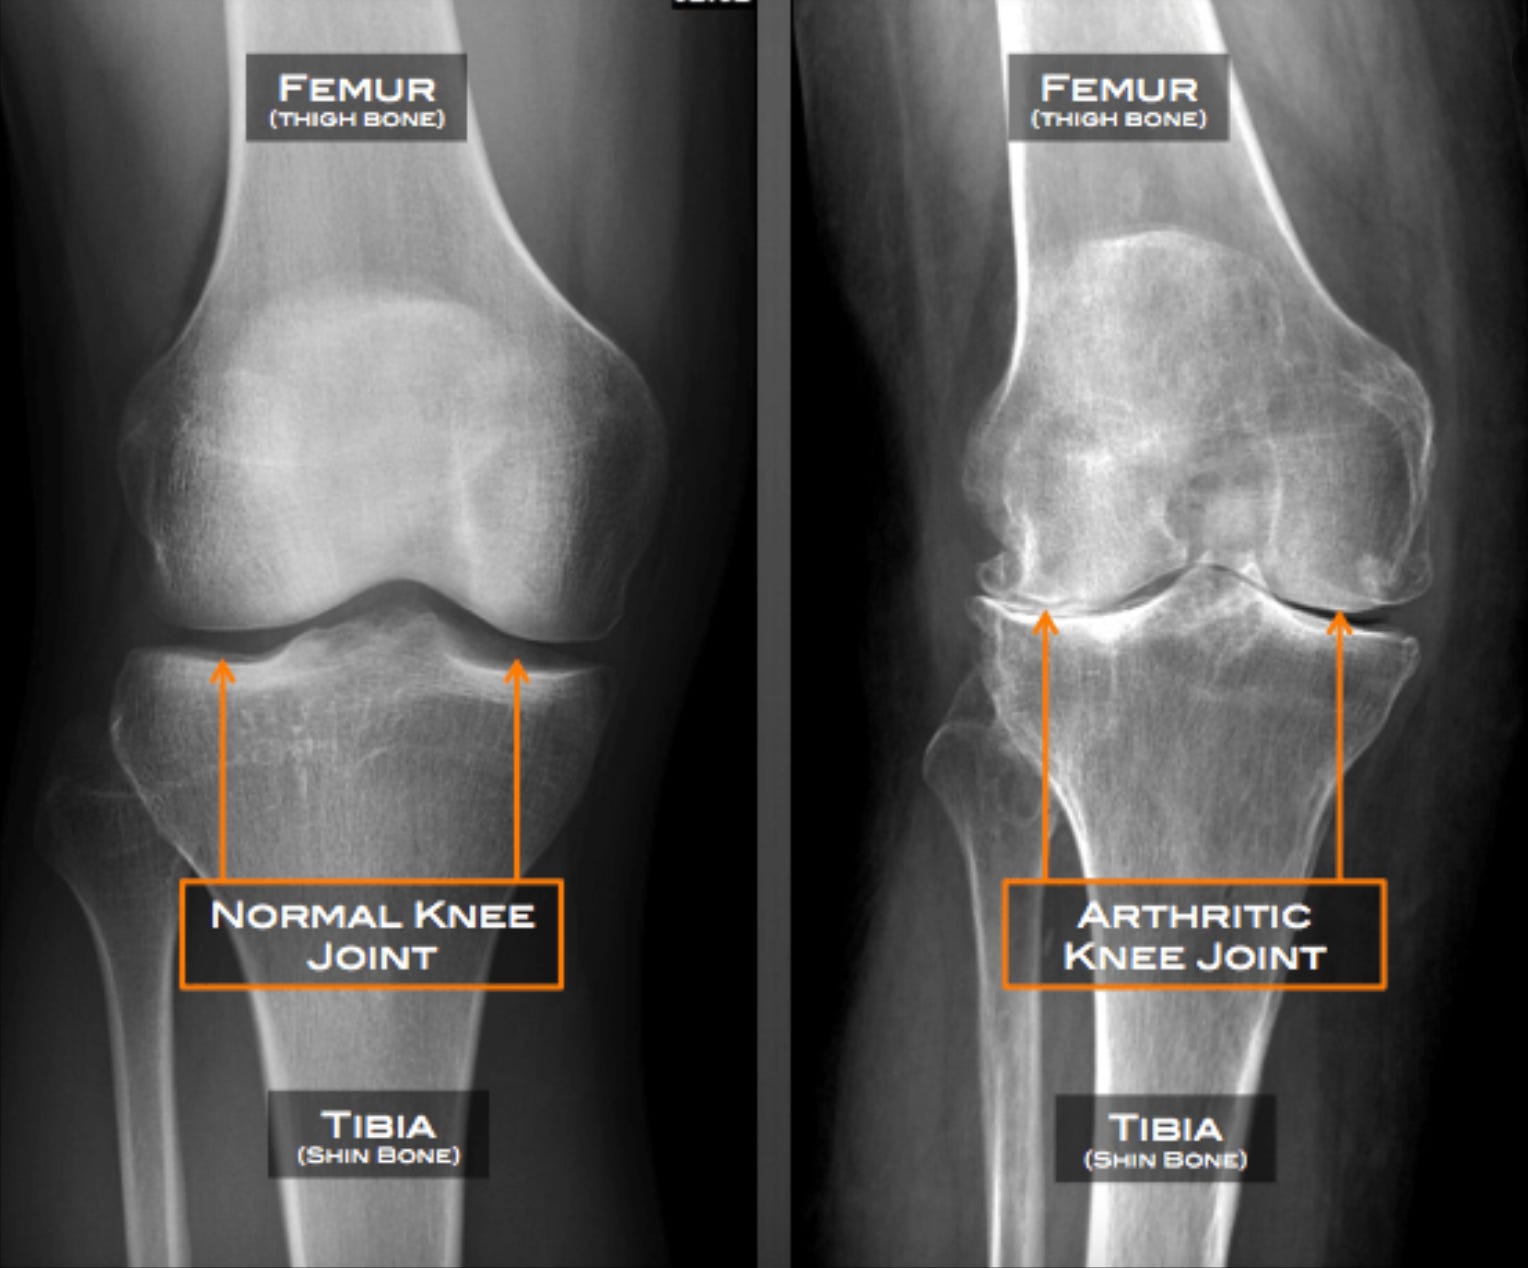
Old age arthritis is commonly diagnosed based on X-ray findings. There are no blood tests for OA/DJD. Note, in the images below, the loss of joint space between the femur and tibia bones of the knee (labeled) indicating wearing away of the protective cushions (called menisci). Note also the thickening of the tibia bone along the lower joint line indicated by the bright white horizontal lines (called subchondral sclerosis) and the hook-like bony projections arising from the corners of the femur and tibia (osteophytes) in the knee of a patient with OA featured on the right.
Inflammatory Arthritis
The second general category of arthritic conditions, termed inflammatory arthritis, is not caused by mechanical wear and tear over time but is instead the result of an autoimmune process whereby cells of the immune system attack the joint tissues. OA typically begins in the cartilage but inflammatory arthritis often begins in the synovial tissues which become acutely inflamed, swollen, and excruciatingly painful. OA comes on gradually and slowly progresses over years while inflammatory arthritis comes in attacks, typically lasting days or weeks at a time, often accompanied by heat in the joints and generalized fatigue. Over time, flare-ups of inflammatory arthritis begin to eat away at bony structures to cause cyst-like erosions.
Diagnosis of Inflammatory Arthritides
Inflammatory arthritis is a feature of many common medical conditions, including psoriasis, lupus, gout, and (the most common of all) rheumatoid arthritis (RA). Many inflammatory arthropathies can be identified by X-ray or MRI but there are also blood tests that help make the diagnosis. We see elevated levels of inflammatory markers like C-reactive protein (CRP) and the presence of auto-antibodies that attack the synovial tissues and cartilage (anti-CCP antibodies and anti-nuclear antibodies). In the case of RA, we may also see the presence of another kind of autoantibody called rheumatoid factor (RF). Over time, those autoantibodies progress past the cartilage to cause cystic erosion of subchondral bone tissue next to the joint.
OA/DJD comes on gradually and slowly progresses from stiffness and discomfort to aching pain over many years, typically later in life. RA and other inflammatory arthropathies can come on earlier in life and present as acute bouts of severe pain and swelling. While patients with OA often find that their symptoms are improved by activity or exercise, those with RA typically find activity unbearable during attacks as it increases pain and swelling.
Birds of a Feather Flock Together
Inflammatory arthropathies involve a more acutely destructive process that sets the table for the concomitant development of OA and both are often seen together in patients who have suffered with RA or other inflammatory conditions for some time.
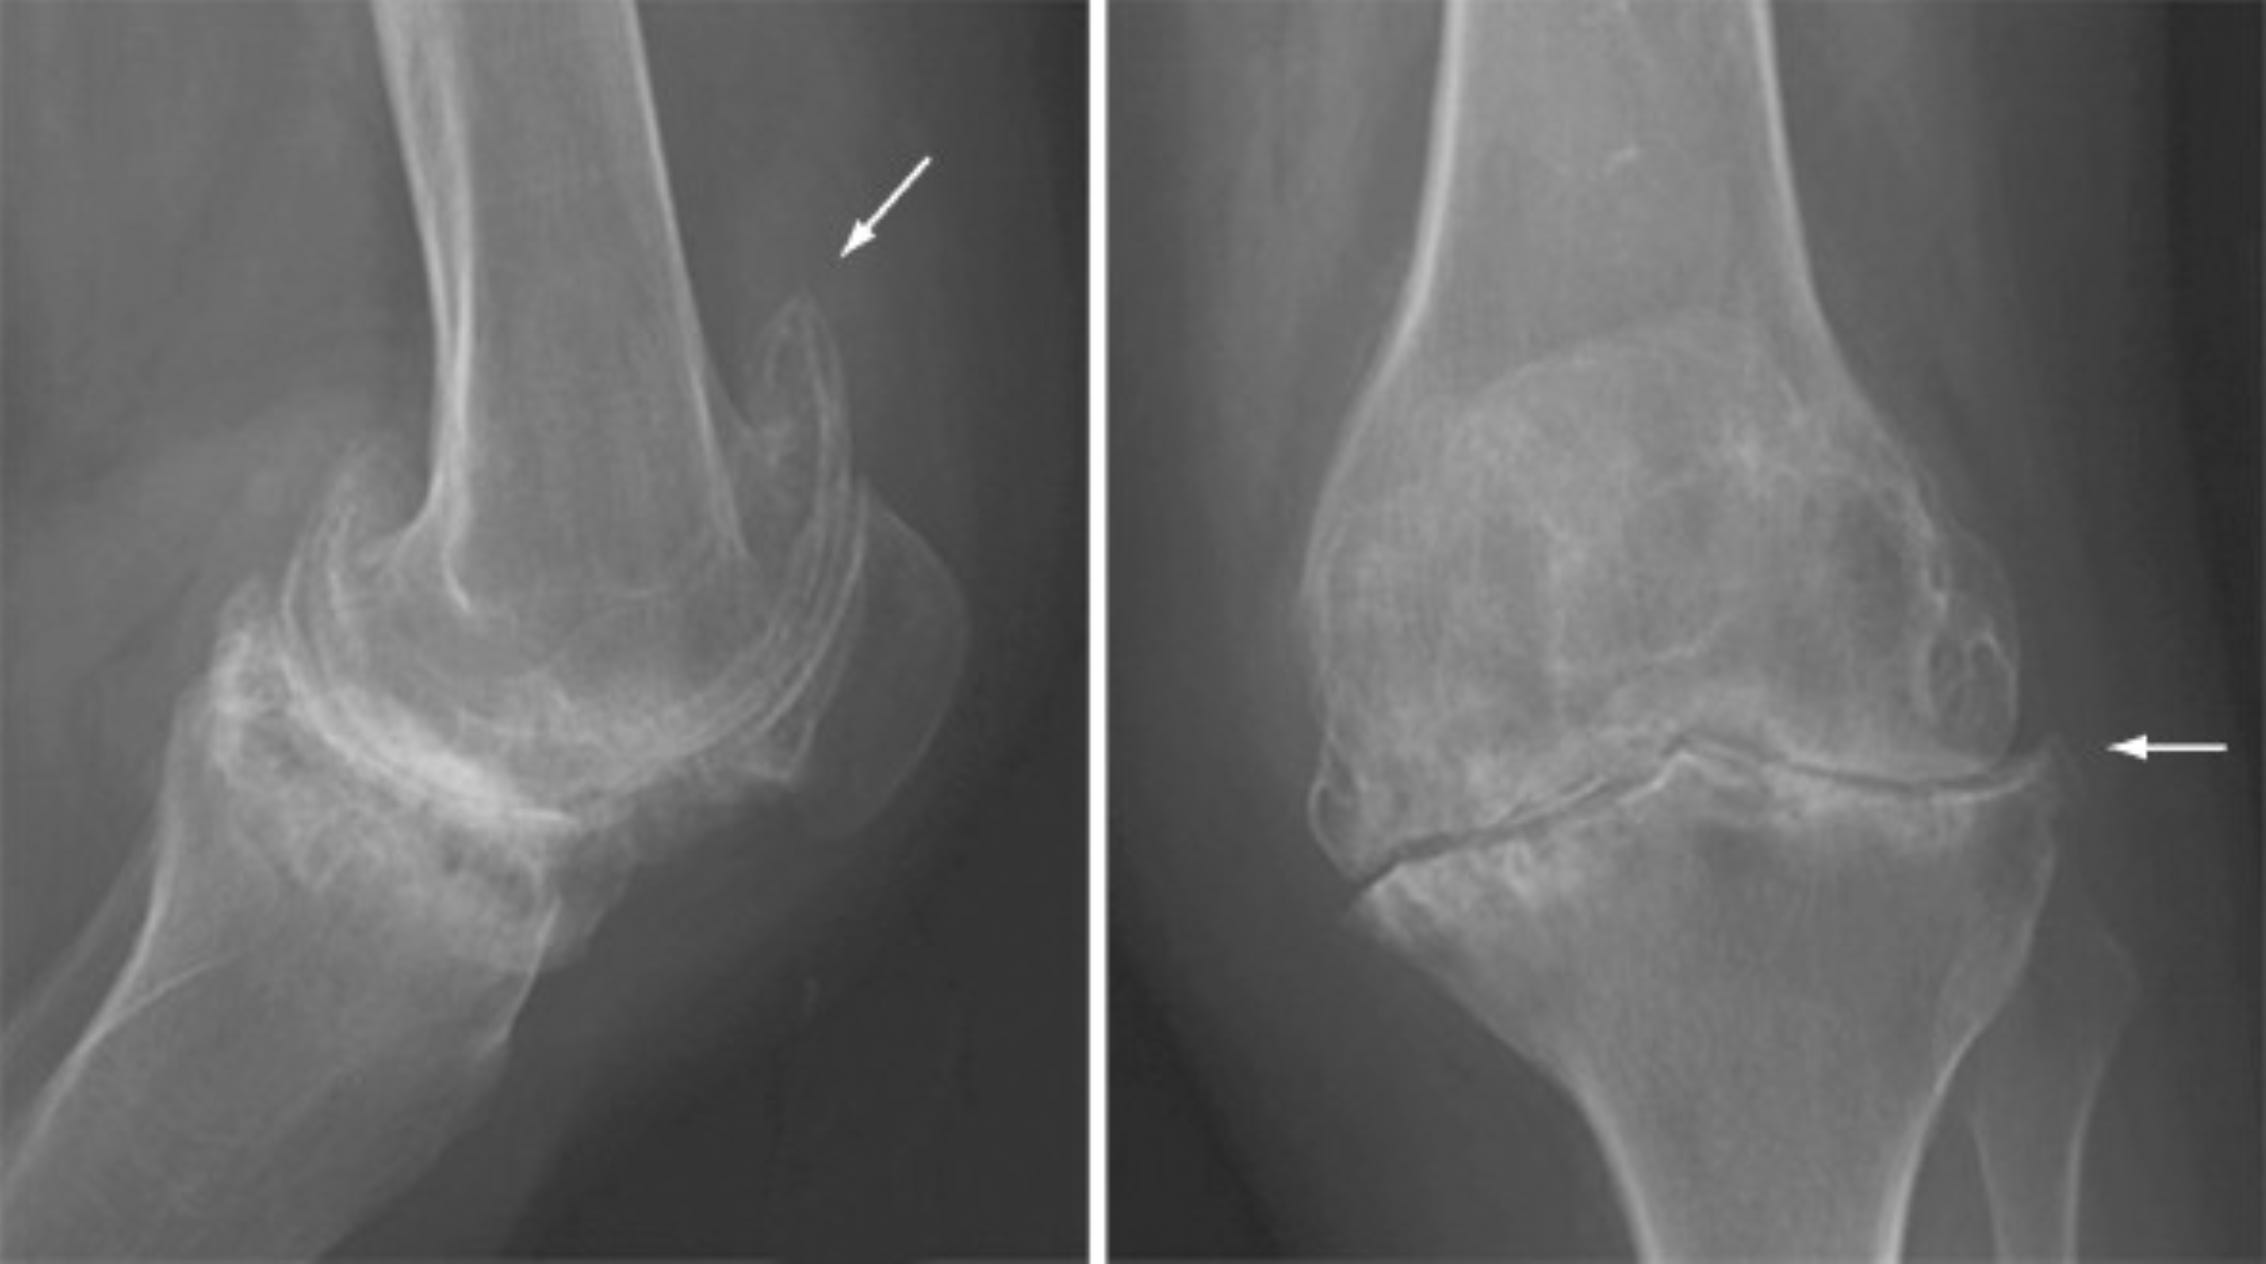
Note in the image below the subchondral sclerosis (horizontal white lines) along the articular surface of the tibia and the osteophytes (denoted by the arrows) growing off of the femur and tibia — findings consistent with OA/DJD. Note also, however, in these same images, the soap-bubble-like appearance of the bone adjacent to the joint, in both the femur and tibia, denoting cystic erosions consistent with RA:
In short, OA has for decades been understood as wear-and-tear arthritis while RA has been understood as an inflammatory arthritis caused by an autoimmune process.
II. Acute v. Chronic Inflammation
New data over the last two to three decades have updated our understanding of old-age arthritis. While OA is not caused by an autoimmune process and is not marked by episodic bouts of acute severe inflammation, it is now believed that chronic low-grade inflammation (caused by obesity) may be a more important driver of old-age arthritis than mechanical wear and tear – even in weight-bearing joints like the knees.
In the clinical research world, this is now widely accepted, with many studies like this one demonstrating a direct relationship between inflammation caused by visceral fat (more about this later) and knee pain — even before any visible signs of arthritis on X-rays – and this one which lays out in detail how the structural changes of OA that we see on X-rays and MRIs, including the destruction of cartilage, disc, and synovial tissue, are caused by a complex biochemical interaction mediated by the so-called 'hormones of the immune system' including proteolytic enzymes (enzymes that break down protein), and inflammatory cytokines (such as interleukins and tissue necrosis factor). These ‘immune hormones’ up-regulate the expression of genes that degrade the integrity of cartilage, disc, and bone tissues in joints while simultaneously blunting the pathways that heal and restore those tissues, leading over time to OA.
But if visceral fat causes chronic low-grade inflammation, and chronic inflammation (not wear and tear) is the chief driver of joint pain and OA, shouldn’t we expect to see a connection between obesity and OA not just in weight-bearing joints like the knees but also in non-weight-bearing joints like the wrists and hands?
In fact, there is a substantial and growing compendium of such data from studies dating back more than 25 years, showing both a strong association between increased visceral fat and OA pain and a reduction of OA pain with weight loss — including in non-weight-bearing joints like the wrists and hands. In this 10-year longitudinal study, a dose-dependent progression (or regression) of OA-related pain in the knees and hands was directly linked to excess body fat. In this 23-year longitudinal study, obesity at baseline was strongly associated with the development and progression of OA in the hands. Perhaps most persuasively, a reduction in body fat but not in body weight has been shown to relieve the symptoms of OA in the knees.
Today is fair to say that acute, severe, auto-immune inflammation is a key driver of conditions like RA and that chronic low-grade inflammation caused by too much visceral fat is a key driver of old-age arthritis.
Now, let’s unpack this a little further by bringing in one of the most important recent breakthroughs in our understanding of metabolic disease: the personal fat threshold hypothesis.
III. Visceral Adiposity in Diabetes and Metabolic Syndrome
Insulin Resistance
You just learned that carrying too much fat is a key driver of old-age arthritis. And I’ll bet you were already well aware that obesity can cause chronic metabolic diseases like type-II diabetes (T2D). But did you know that the risk of someone who is morbidly obese developing T2D is not ten or even fifty percent higher compared to someone lean; it isn't ten or even fifty times higher. The risk of a morbidly obese person developing T2D is almost one hundred-fold higher than a lean person.
In the famous Nurses’ Health Study, which followed 114,000 women over 14 years, the risk of developing T2D was 93 times higher among women who had a body mass index (BMI) of 35 or more at the start of the study, compared with those with BMIs in the healthy range (conventionally understood to be between 18 - 25 for adult women). And we see that weight gain during adulthood increases diabetes risk for women even among those whose BMI remains in the healthy range. And the Health Professionals Follow-Up Study shows that the same holds for men.
It is widely accepted that obesity drives T2D by inducing insulin resistance. But, strangely, resistance to insulin does not occur in all people who are obese on BMI and some lean people with BMI in the healthy range do develop insulin resistance and diabetes. At the very least, we should say that there is more to the story than the simple understanding that obesity causes insulin resistance and T2D.
Fat, Insulin, and Diabetes
The following graph was taken from German research scientist Dr. Mario Kratz's video lecture which can be found here and informs or is the source of much of what follows. It shows how, as BMI goes up, so does insulin resistance but also how some individuals with relatively low BMI have fairly high levels of insulin resistance — such as the subject represented in the graph by the green dot — while some with high BMI have very low levels of insulin resistance — like the subject represented in the graph by the orange dot:

One reason for this seeming paradox is that some people who weigh a lot don't have a lot of body fat while others may be in the normal zone for weight on BMI but are nevertheless carrying plenty of fat. The orange dot in the graph above represents a bodybuilder with a lot of lean muscle mass. He weighs a lot and, according to the BMI scale, is technically ‘obese’ even though he has extremely low levels of body fat. The green dot, by contrast, represents a so-called 'skinny fat' person. His BMI is in the normal range but he is carrying too much fat.
In other words, a high BMI does not necessarily mean that someone is truly obese and a normal BMI does not guarantee that someone is not obese if we use the word obese to mean holding unhealthy levels of stored body fat. This is one reason why BMI, though helpful for understanding general trends at the population level, can break down completely when used in medical decision-making for individual patients.
A better metric for gauging metabolic health (and specifically insulin resistance) is body fat percentage — something I perform routinely on patients using a simple hand-held device. Let's look a the same population including the same bodybuilder and skinny-fat person but with the X-axis changed from BMI to body fat percentage:

With this simple adjustment, the lean bodybuilder with almost no visceral fat (orange dot) has shifted dramatically to the left, appropriately far from the obese range, while the skinny-fat subject is shifted (also appropriately) well to the right, into the overweight range. Our understanding of the metabolic health of these two subjects is essentially reversed when we swap out BMI for body fat percentage.
But even body fat percentage does not track perfectly with insulin resistance and T2D as is demonstrated in the graph below which shows a progressively widening variance in the level of insulin resistance among subjects as body fat percentage increases:

So there is still more to the story of obesity and T2D than either BMI or body fat percentage can tell. That’s where the Personal Fat Threshold hypothesis comes in…
The Personal Fat Threshold Hypothesis (PFT)
In broad terms, we can think of the body as having three distinct energy storage compartments — one beneath the skin (the subcutaneous compartment), one encasing our body's internal organs (the visceral compartment), and one within our visceral organs and muscles (the ectopic compartment). When we take in more calories than we burn, we store the excess energy intake as fat (triglyceride) inside adipose cells (cells that are meant to store fat) in these three compartments, sequentially, through a process driven by insulin.
In the vast majority of people, fat is stored in the subcutaneous compartment first. Only when those subcutaneous adipose cells have reached or are approaching their maximum storage capacity do additional calories begin to be stored in the visceral compartment. And it is when visceral fat begins to accumulate that we also see a sudden steep rise in insulin resistance. But what is it about visceral adipose tissue (VAT) that drives insulin resistance and what does it mean to reach the maximum storage capacity of subcutaneous adipose tissue (SCAT)?
We know that VAT is more metabolically active than SCAT. Visceral adipocytes (fat cells) have been shown to have more hormone (glucocorticoid and androgen) receptors and to be less sensitive to insulin compared to subcutaneous adipocytes. When adipocytes in the visceral compartment fill with fat, they turn on cellular machinery that produces inflammatory cytokine hormones like interleukins and tissue necrosis factor (IL-1 and TNF-alpha) — the same inflammatory intermediaries implicated in OA. It seems that inflammation of adipose tissue is what makes them resistant to insulin and insulin resistance is what drives T2D (keep reading, this is about to get really interesting).
However, new evidence has added yet another layer to our understanding. In healthy people, SCAT consists mainly of relatively small adipocytes along with some pre-adipocytes (immature fat cells that are not yet able to store fat) and blood vessels that supply the adipocytes with oxygen and other nutrients. As we gain weight, adipocytes swell with fat, pushing those cells furthest from the arterial source even farther away from their blood supply. As more cells in the SCAT swell with fat, pre-adipocytes are induced to mature, creating new adipocytes, and expanding the SCAT’s storage capacity. As they too fill with fat, those cells at the periphery are pushed still farther from their blood supply, eventually inducing a state in which not enough oxygen makes it to those cells (tissue hypoxia) leading to oxidative stress (a state of inflammation caused by an excess of free radicals that leads to cell damage).
As the process of weight gain continues, these stressed, hypoxic cells become so fragile and swollen that they begin to rupture, causing the fat and debris inside them to spill into the interstitial spaces (the spaces between the cells that make up fat tissue) of the SCAT. In response to this, the body initiates an acute inflammatory response, summoning white blood cells called monocytes to the scene of the injury where they induce three important effects:
Some monocytes mature into macrophages — large cells that act like vacuum cleaners, gobbling up all that interstitial debris caused by the recently ruptured adipocytes.
Some other monocytes release cytokines that further gin up inflammation and inhibit insulin signal transduction, rendering local adipocytes insulin-resistant. This makes sense. Insulin drives triglyceride and sugar into these cells and blocks them from being able to release their fat for energy. When adipocytes in the SCAT are filled with fat, insulin suddenly becomes a dangerous hormone that can cause those cells to rupture. In this way, insulin resistance can be seen as a form of self-protection, preventing more adipocytes from bursting and allowing overstuffed adipocytes to release their fatty acids into the blood during periods of caloric deficit (when we’re hungry or sleeping), allowing them to shrink a little.
Monocytes release other cytokines that induce the growth of new blood vessels (angiogenesis) to supply blood and oxygen to the adipocytes at the far reaches of the SCAT, reducing hypoxia and oxidative stress. This too is self-protective.
In short, as the subcutaneous compartment approaches its breaking point for fat storage, injury occurs triggering SCAT to undergo changes needed for self-protection.
But these self-protective adaptations come at a cost. The steep rise in insulin resistance that begins when that breaking point is reached and adipose cells start to burst renders SCAT unable to take up sugar and fat from the blood after meals, driving up blood glucose and shunting sugar and fatty acid storage toward VAT — a shift that coincides with a dramatic increase in inflammatory cytokines that can lead to the development of metabolic syndrome and pre-diabetes (more about this below).
As fat storage in the visceral compartment increases, the VAT may also reach the point of maximum energy storage, beyond which the same sort of oxidative stress, hypoxia, cellular injury, and inflammation take place, leading to an even more dramatic increase in insulin resistance and ultimately, T2D. When the VAT’s storage capacity is maxed out, additional excess energy storage gets shunted to the third and final fat repository: the ectopic compartment.
Accumulation of fat within our internal organs like the liver and pancreas, and in muscle cells, pushes inflammation levels still higher and disrupts the normal functioning of those organs. It is now estimated that as many as a third of all Americans may have reached this point of clinical obesity as evidenced by an accumulation of fat within the liver, known as non-alcoholic fatty liver disease (NAFLD) which can be seen and measured on imaging studies (more about this later).
Different Strokes For Different Folks
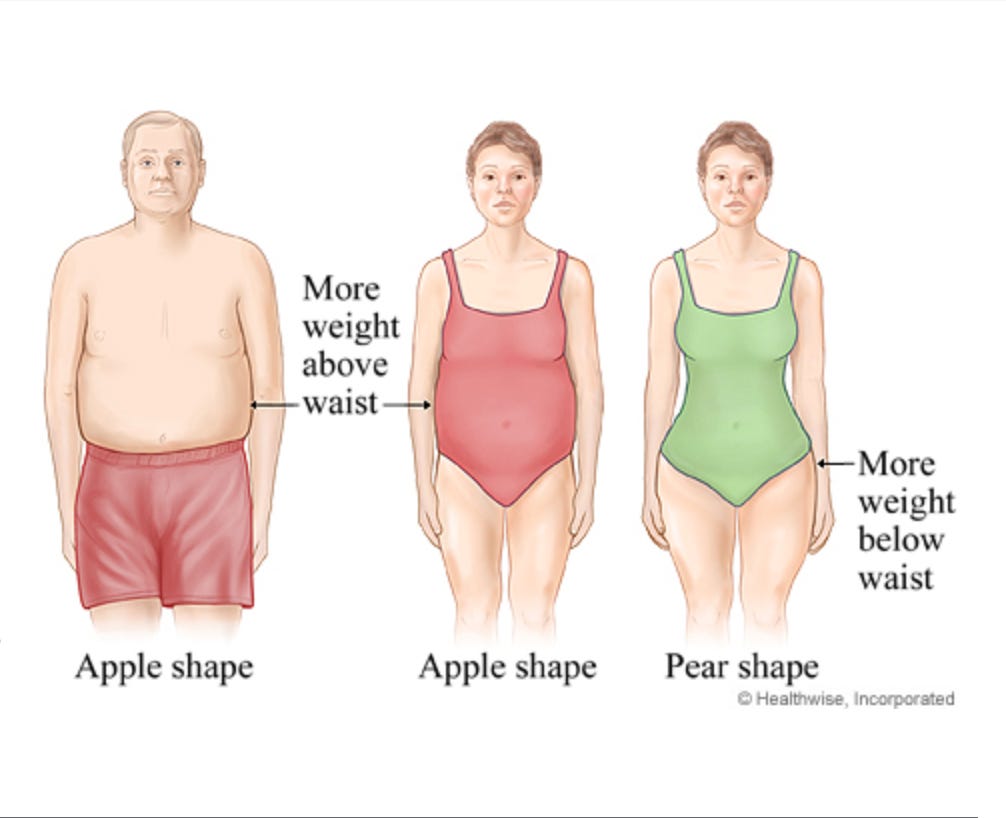
For clinicians, it is critical to keep in mind that before a patient reaches the breaking point for energy storage in SCAT, they may be metabolically quite normal by standard blood tests. Equally important (and critical to the PFT hypothesis) is the fact that individuals differ on how much fat their SCAT can accommodate. Women tend to have a significantly greater ability to store fat in the SCAT of the thighs, breasts, and buttocks compared to men. Black and Asian people have slightly greater SCAT capacity than White people do. Body type also plays a role such that people with so-called 'pear-shaped' frames can accommodate far more fat in their subcutaneous adipose tissues than those with 'apple-shaped' frames. In other words, how much fat can be safely stored in the SCAT is different for different people, and that is the essence of the PFT hypothesis.
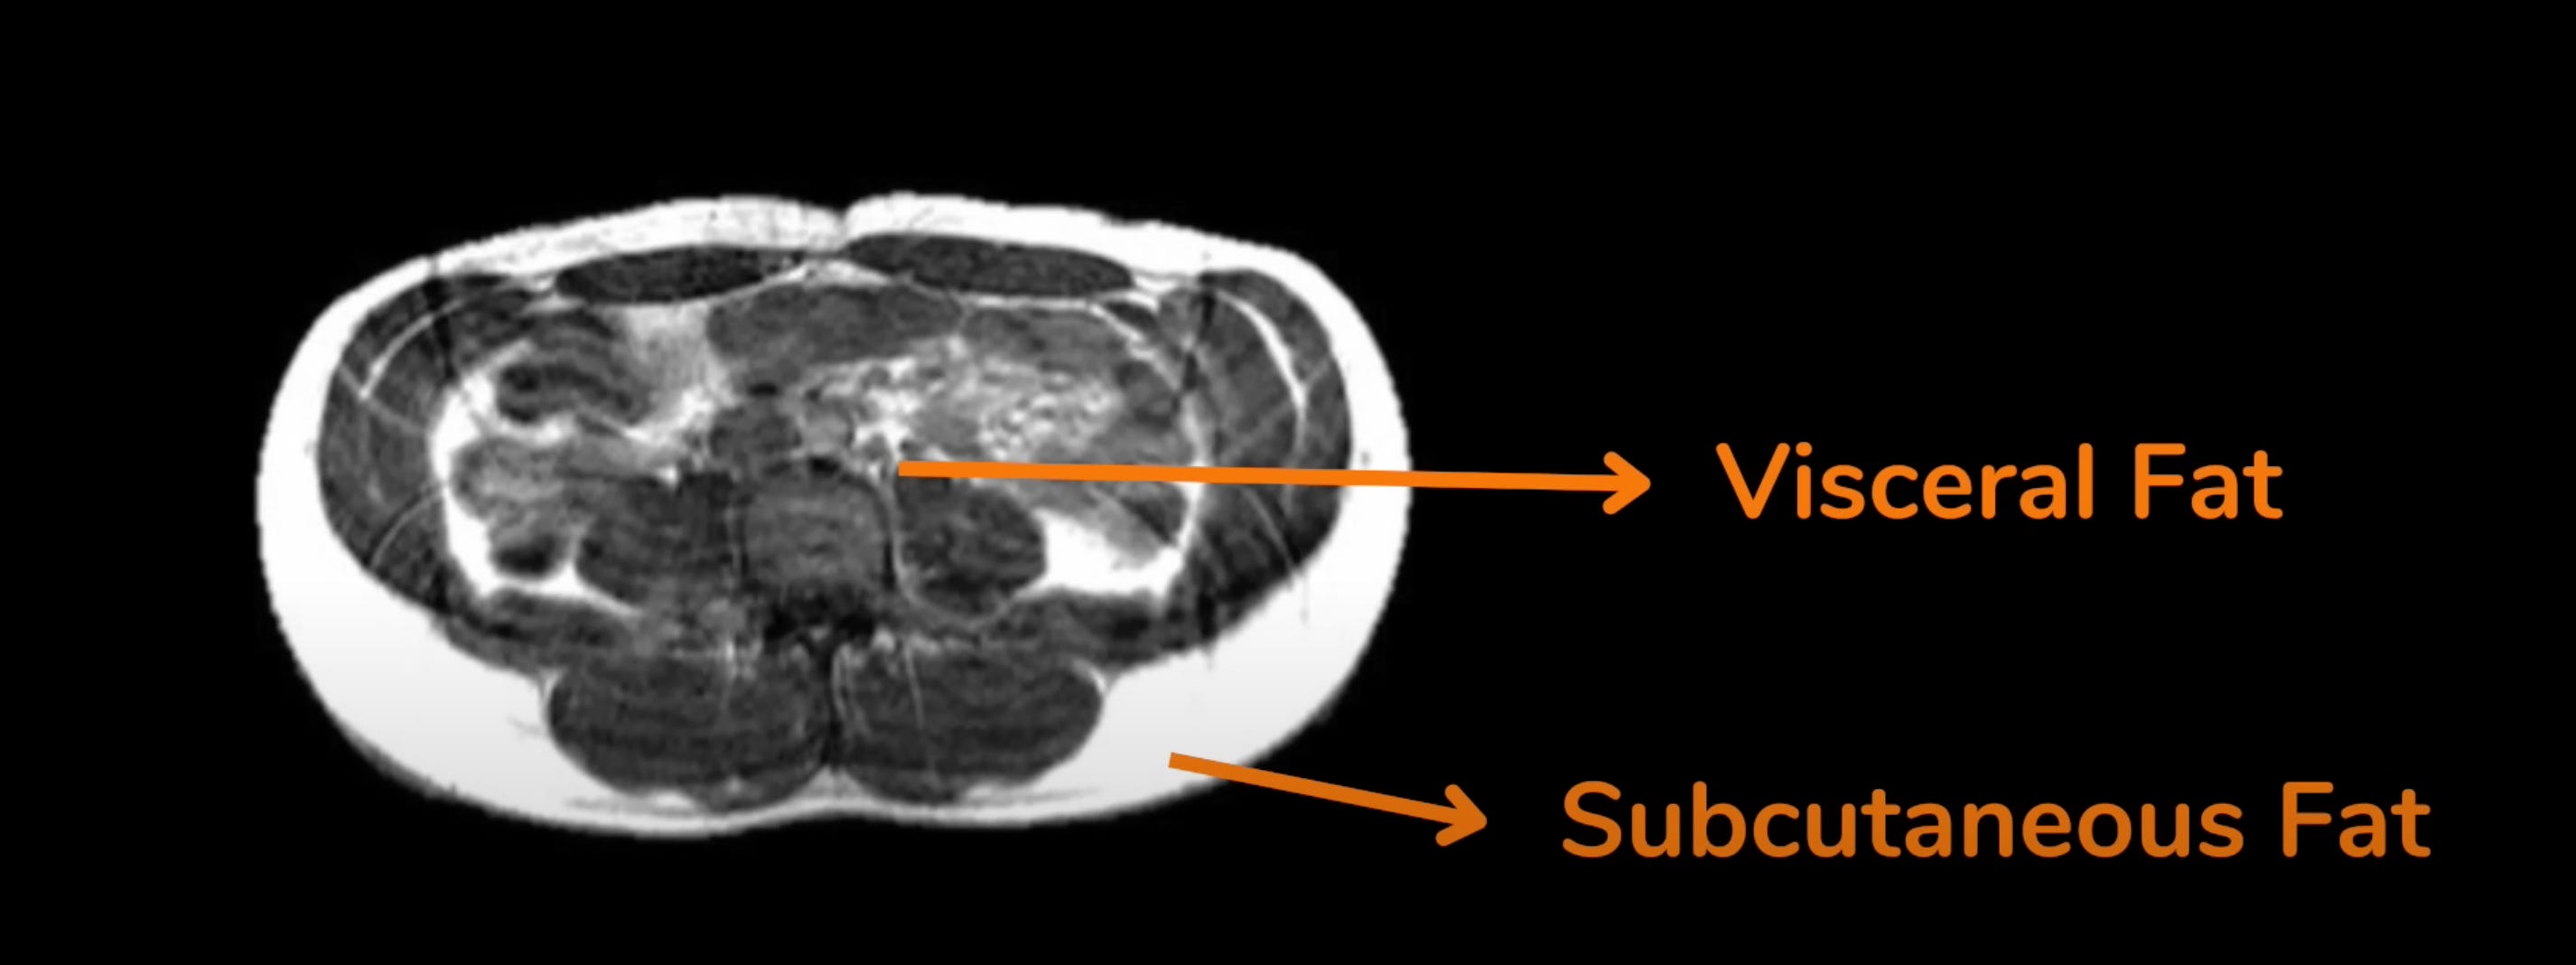
Let's look at the case of one 'pear-shaped' patient who is clinically ‘obese’ by BMI and even has a fairly high body fat percentage but nevertheless, has quite low levels of insulin resistance. Such patients used to be perplexing but, thanks to the PFT hypothesis, that’s no longer the case. On MRI, we can see substantial accumulation of fat (in white) in his (non-metabolically active) SCAT but almost none in his (metabolically active) VAT:
Now, let's compare that same patient to another patient of the same age and sex, with the same BMI and almost the same body fat percentage but with high levels of insulin resistance. Can you spot the difference on MRI?

The second patient with high insulin resistance (seen on the right) has more than three times the amount of visceral fat compared to the first patient. He also has high levels of inflammatory blood markers (more about this later).
The patient on the left has a 'pear-shaped' body with a lot of his subcutaneous fat distributed in the thighs, buttocks, arms, and face in addition to around the waist. The patient on the right has an 'apple-shaped' body with most of his fat centered around the abdomen as evidenced by the massive fat accumulation in both the SCAT and VAT of his mid-section.
People with obesity who are insulin-sensitive tend to have little fat in their VAT, liver, and muscles, and lower levels of chronic inflammation on blood markers. By contrast, obese people with T2D tend to have a lot of fat in their visceral and ectopic fat depots, often have NAFLD, and consistently have high levels of chronic inflammatory blood markers.
The PFT hypothesis theorizes that:
Insulin resistance (and therefore, T2D) is driven by inflammation.
Inflammation begins when the fat storage capacity in the SCAT is exceeded.
Every person has a different capacity for fat storage in the SCAT.
Lipodystrophy
How do we know that all of these things that consistently run together such as accumulation of fat in the visceral compartment, elevated levels of inflammatory markers, and insulin resistance are causally linked, as is theorized by the PFT hypothesis? For one thing, studies consistently demonstrate that weight gain does not scale linearly with negative health consequences. Wide variances are seen in the metabolic health of patients who are lean, overweight, and obese on BMI. By contrast, MRI and other imaging evaluations (such as DEXA scans –more about this later) consistently demonstrate that once patients begin accumulating fat in their visceral compartment, a diagnosis of metabolic syndrome and/or pre-diabetes is soon to follow, and once fat begins to accumulate in the ectopic compartment such as in the liver (NAFLD), T2D is not far off. Perhaps most persuasively, patients with a disease called lipodystrophy syndrome who are unable to store fat in the SCAT or VAT develop insulin resistance, NAFLD, and T2D with weight gain much earlier — often before their body fat percentage has drifted out of the normal range.
Between one and five million Americans have lipodystrophy syndrome, a condition that can be congenital or acquired (as in, for example, patients taking anti-retroviral medications for HIV) and consists of a paucity of adipocytes in the SCAT and VAT. These patients tend to have skinny arms and legs and often somewhat protruding abdomens but without the ability to pinch a roll of fat around the midsection. In the following images, we see a comparison between the abdomens (upper row) and thighs (lower row) of, from left to right, a patient with lipodystrophy syndrome and metabolic disease; a patient with ‘obesity’ on BMI but without metabolic disease; and a patient with obesity and metabolic disease:

Of note in the patient above with lipodystrophy syndrome (furthest to the left) is the substantial accumulation of fat in the liver, pancreas (white areas), and thigh muscles (light gray) despite virtually no fat in the SCAT or VAT of the abdomen and thighs. Inflammation causing insulin resistance in patients with lipodystrophy syndrome is driven by fat storage in ectopic depots, not in VAT. Mice that have been genetically altered to have lipodystrophy develop insulin resistance and diabetes quickly with even small amounts of weight gain but transplantation of subcutaneous fat into these animals almost immediately reverses this.
Chronic Inflammation Drives Chronic Diseases
Additional evidence in support of the PFT hypothesis comes from new studies showing that anti-inflammatory therapies can improve insulin resistance and beta cell (the cells in the pancreas that make insulin) function in patients with T2D and metabolic syndrome. Interestingly, one of the purported (but, until recently, less well understood) mechanisms by which the diabetes medicine metformin works is by acting as an anti-inflammatory therapy.
Finally, weight loss studies in patients without lipodystrophy syndrome consistently show that insulin resistance and inflammation go down in tandem as patients purge fat but this effect is seen only when the fat loss comes from the ectopic and visceral compartments, not when weight loss is confined to the SCAT.
While surgical removal of VAT improves insulin resistance and plasma insulin levels, the removal of SCAT (as through liposuction) does not confer any metabolic benefits. Some data even show that fat storage in SCAT may have cardio-metabolically protective effects but no such data exist to support the idea that VAT or ectopic fat have any health-promoting qualities.
A Little Can Go A Long Way
We gain weight from the outside in (SCAT, VAT, then ectopic). Fortunately, we tend to lose weight in the reverse order. Since ectopic tissues like the liver and muscles are the last energy storage depot in people without lipodystrophy, they tend to be the first to purge their fat during weight loss. These are the tissues responsible for inducing the highest level of inflammation and insulin resistance when they fill with fat. This helps explain why even small amounts of weight loss can dramatically improve T2D in many obese patients.
In addition to driving metabolic syndrome and T2D, inflammation caused by excessive fat accumulation in the visceral and ectopic compartments has consistently been implicated as a driver of other serious chronic illnesses. For example, visceral and pericardial fat (another ectopic energy storage depot) have been implicated as drivers of heart disease; the inflammation of NAFLD can cause injury and scarring of liver tissue (cirrhosis), increasing the risk of hepatic cancer; mesenteric fat around the intestines has been strongly associated with colon cancer; and the inflammation associated with increased fat storage in VAT has been implicated as a driver of decreased kidney function.
How Do We Know if a Patient Has Reached Their Personal Fat Threshold?
The best way to determine whether or not a patient has crossed their PFT is with an MRI. But this is expensive and getting insurance approval can be difficult. An easier and far less expensive test is a DEXA scan. Routinely used to measure bone mineral density, newer DEXA units can also get an accurate estimate of body fat percentage and provide an indirect measurement of SCAT and VAT volume.
A DEXA scan value of 100 or less indicates low amounts of fat storage in visceral or ectopic depots and a low risk of insulin resistance and metabolic syndrome or diabetes; 100 - 160 indicates elevated risk; while over 160 indicates a high risk. This short video may be helpful when deciding who and when to screen.
Another common and relatively inexpensive test that can be used to evaluate ectopic adiposity is diagnostic ultrasound. Identifiable accumulation of fat in the live, even if the diagnostic threshold for NAFLD is not met, strongly suggests that a patient has reached or exceeded their PFT.
Finally, BMI, or (better still) body fat percentage, combined with specific blood tests such as HOMA-IR, hsCRP, and fasting triglycerides can help us gauge whether or not a patient has reached or exceeded their PFT. If most or all of these markers are elevated, the likelihood that someone has reached or exceeded their PFT is high and the more elevated these markers get the more likely that is to be true. The following chart can be used as a handy reference:

III. What Do Arthritis, Diabetes, and So Many Other Chronic Diseases Have in Common? Chronic Low-Grade Inflammation
The categorical distinction between autoimmune inflammatory arthropathies like RA, and old-age arthritis became more nuanced when the first major study was published in Nature, demonstrating that OA, while not driven by episodic bouts of acute, severe inflammation like that which we see in RA, is caused at least as much by chronic low-grade generalized inflammation as it is by wear and tear. We now know that the same is true in patients with degenerative disc disease in the spine. Over the last two decades, similar links between chronic low-grade generalized inflammation, and heart disease, strokes, and cancers of all kinds have been established.
If there is a unifying theory of chronic non-infectious diseases like OA and T2D, it must almost certainly include the idea that chronic low-grade generalized inflammation caused by the accumulation of visceral and ectopic fat is a key driver. It is hard work for busy clinicians to engage meaningfully with patients about diet and weight loss. Compounding the problem, not all healthcare providers are up to date on the most current understanding of these things. Yet, if there is a single intervention that healthcare providers can make to improve the health of the majority of their patients, it is to provide guidance that can help patients establish the right lifestyle habits.
An anti-inflammatory diet may be the centerpiece of lifestyle medicine with the purging of visceral and ectopic fat as its chief goal. For patients willing to take this on, ridding their bodies of excess ectopic and visceral fat can reasonably be expected to have profound health and longevity benefits. For OA and T2D, it works better and costs less than medicines, surgeries, intra-articular joint injections, or physical medicine modalities, all without the side effects or serious collateral damage that can be caused by many traditional interventions.
In my experience, the key to purging visceral and ectopic fat and achieving low levels of chronic inflammation is to avoid 'hacks' like ketosis, intermittent fasting, and calorie restriction diets, and to adopt instead a philosophy and mode of eating that targets the enrichment of the gut microbiome and is joyfully sustainable in the long-term. That dietary approach, which I call the Human Diet, may be found here.